1. Introduction
Every year, Americans collectively drive more than 3.2 trillion miles, enough to circle the Earth over 128 million times. According to the Federal Highway Administration (FHWA), the average licensed driver covers roughly 13,662 miles per year, or about 37 miles a day.
This metric vehicle miles traveled (VMT) per licensed driver, offers far more than trivia. It reveals how Americans live, work, and spend. In this article, we’ll break down the latest national data, explore demographic and regional differences, and examine the social and economic forces shaping how much and why we drive.
2. The Current National Average and Data Compilation
Recent FHWA data places the national average at 13,662 miles per licensed driver. To arrive at that number, the agency compiles input from every state’s highway department, combining traffic-counter readings, fuel-use records, odometer surveys, and household travel data. These sources together estimate total national vehicle miles traveled, which are then divided by the number of licensed drivers.
Put simply:
Total Miles Driven ÷ Licensed Drivers = Average Miles per Driver
That annual mileage translates to roughly 1,138 miles per month, or a 37-mile daily round trip, similar to the average U.S. commute distance.
While the average provides a national snapshot, it masks wide differences between groups, states, and lifestyles. To understand those variations, we must dig deeper.
3. Dissecting the Data: Demographic and Geographic Variations
3.1 Mileage by Demographics
Age:
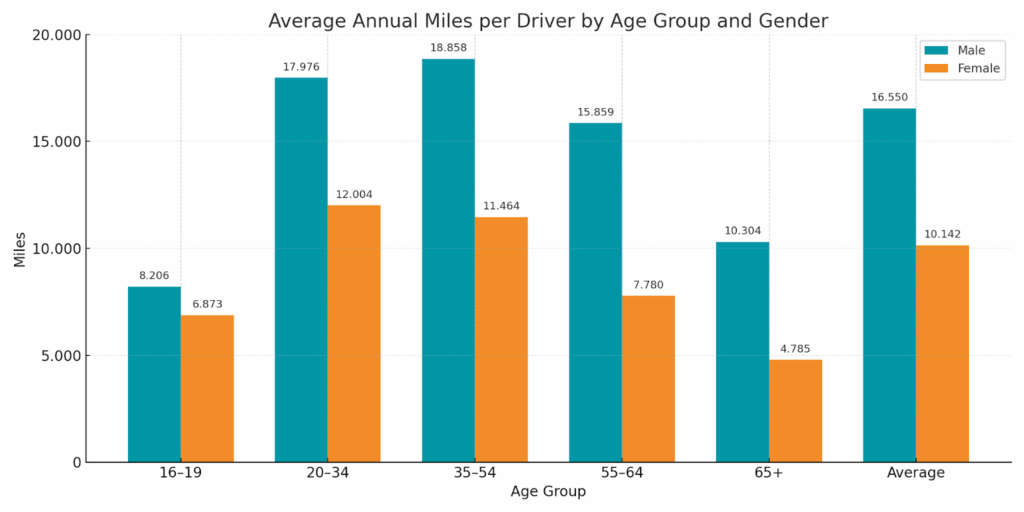
Drivers between 20 and 54 rack up the most miles, often exceeding 15,000 per year, driven largely by work commutes, family activities, and longer leisure travel. Teen drivers (16–19) and seniors (65+) drive about 7,500 miles annually, limited by cost, access, and lifestyle needs.
Gender:
Men still drive significantly more than women, about 16,550 miles vs. 10,140 miles per year, a gap that persists due to occupational patterns (e.g., delivery, trade, and commuting distances) and longstanding social habits. However, women’s share of total VMT has steadily risen with workforce participation and household mobility roles.
3.2 Mileage by Geography
Driving behavior changes dramatically with landscape and infrastructure.
- Highest-Mileage States: Wyoming, Alabama, Mississippi, and New Mexico, each averaging above 20,000 miles per driver annually. Wide rural geography, sparse public transit, and long commute distances are key factors.
- Lowest-Mileage Areas: New York, Washington D.C., Rhode Island, and Hawaii hover under 10,000 miles per driver. Dense urban cores, transit systems, and higher car ownership costs reduce reliance on personal vehicles.
Population density, regional economies, and weather all contribute: harsh winters limit recreational driving, while wide western states depend heavily on highways for daily life.
Breakdown Average Miles Driven by State
| State | Average Miles Driven by State |
| Alabama | 17,523 |
| Alaska | 10,510 |
| Arizona | 13,024 |
| Arkansas | 16,702 |
| California | 11,409 |
| Colorado | 12,046 |
| Connecticut | 11,285 |
| Delaware | 11,451 |
| Florida | 13,807 |
| Georgia | 17,508 |
| Hawaii | 10,980 |
| Idaho | 13,756 |
| Illinois | 12,193 |
| Indiana | 20,560 |
| Iowa | 13,896 |
| Kansas | 15,269 |
| Kentucky | 16,050 |
| Louisiana | 16,612 |
| Maine | 13,816 |
| Maryland | 12,900 |
| Massachusetts | 11,648 |
| Michigan | 12,331 |
| Minnesota | 13,957 |
| Mississippi | 19,517 |
| Missouri | 18,514 |
| Montana | 15,517 |
| Nebraska | 14,671 |
| Nevada | 12,506 |
| New Hampshire | 11,304 |
| New Jersey | 11,349 |
| New Mexico | 17,786 |
| New York | 9,548 |
| North Carolina | 14,960 |
| North Dakota | 16,300 |
| Ohio | 13,155 |
| Oklahoma | 17,432 |
| Oregon | 11,780 |
| Pennsylvania | 10,950 |
| Rhode Island | 9,903 |
| South Carolina | 14,417 |
| South Dakota | 14,962 |
| Tennessee | 16,442 |
| Texas | 15,523 |
| Utah | 15,243 |
| Vermont | 14,899 |
| Virginia | 14,062 |
| Washington | 9,819 |
| Washington D.C. | 6,694 |
| West Virginia | 13,334 |
| Wisconsin | 15,125 |
| Wyoming | 21,589 |
4. Driving Forces: Factors Influencing Modern Mileage
4.1 Remote and Hybrid Work
Since the COVID-19 pandemic, remote and hybrid work have permanently reduced commuting miles. Fewer five-day commutes mean lower weekday traffic volumes, especially in major metro regions.
4.2 Economic Conditions
Mileage closely tracks economic cycles. When gas prices spike or disposable income falls, Americans consolidate trips and delay leisure driving. Conversely, strong labor markets push VMT upward.
4.3 E-Commerce and Delivery Growth
While personal driving may dip, commercial VMT from delivery vehicles has surged. Amazon vans, gig-delivery drivers, and local courier fleets now account for a growing share of total roadway activity, shifting mileage from private cars to commercial vehicles.
4.4 Infrastructure and Policy
Urban design plays a long-term role. Investments in mass transit, bike lanes, and zoning density reduce reliance on cars. Meanwhile, improved fuel efficiency standards and the rise of EVs may alter future driving patterns, as lower per-mile costs can encourage more trips.
5. Historical Trends and Future Projections
5.1 Historical Context
From 1989 to 2019, American driving expanded by roughly 2 percent per year – a reflection of economic growth, suburbanization, and cheap fuel.
Then came 2020: nationwide lockdowns caused the steepest decline in U.S. driving history, from about 14,263 miles in 2019 to 12,724 in 2020 – a 10.8% drop.
5.2 Post-Pandemic Recovery
By 2023, most drivers had returned to near-normal habits, though total VMT remains slightly below pre-pandemic levels. The FHWA’s Spring 2024 Forecast anticipates slower growth going forward around 0.4 percent annually through 2050 as population growth cools and digital workplaces endure.
The Road Ahead
Future driving volumes hinge on:
- Autonomous vehicle adoption — could raise mileage via on-demand fleets.
- Energy prices — sustained high fuel costs suppress discretionary driving.
- Urban migration and telecommuting — may continue moderating VMT growth.
The U.S. driver’s footprint, once steadily expanding, now faces a plateau era defined by technology and lifestyle change.
6. The Practical Impact of Annual Mileage
6.1 Vehicle Value
Mileage remains a central factor in depreciation. The “sweet spot” of 12,000–15,000 miles per year defines “average use.” Exceed it consistently, and resale value can drop faster – sometimes 5–10% more per year for high-mileage vehicles.
6.2 Car Insurance
While not always the case, some insurers treat mileage as a direct risk indicator: more miles = greater exposure to accidents.
6.3 Maintenance and Safety
Every additional 10,000 miles means more frequent oil changes, brake checks, tire replacements, and wear-related costs. Higher mileage also accelerates depreciation on safety components – an important factor for older vehicles.
7. Conclusion
The average American drives about 13,662 miles each year. While that may be the overall average, that only tells part of the story. Age, geography, economics, and lifestyle profoundly shape how and how far we travel.
Understanding these patterns matters not just for individual budgeting and insurance planning, but for broader public policy. From infrastructure funding to emission targets, America’s annual mileage remains a mirror of its economy, its cities, and its changing way of life.
Sources:
United States Department of Transportation
https://www.fhwa.dot.gov/ohim/onh00/bar8.htm
https://www.fhwa.dot.gov/policyinformation/statistics/2019/pdf/ps1.pdf